Every few years, someone claims a new “most-watched event in television history,” and the claim is almost never wrong, exactly, because it depends entirely on which number you pick. Nielsen measures average audience. FIFA and the IOC report cumulative reach, meaning anyone who tuned in for at least a minute counts. A Super Bowl figure is a U.S.-only number chasing a global one. None of that makes the numbers fake. It just means a credible ranking has to say, row by row, which metric produced which figure. That is the exercise below, built from official broadcaster and rights-holder data rather than round, unsourced estimates.
This is a companion piece to our ongoing Data & Analytics coverage, where we try to put a verifiable number behind the claims that get repeated in sports media until they harden into fact.
Methodology, in brief
Three metrics show up here. Average audience is the mean number of people watching at any given moment, the standard U.S. broadcast metric Nielsen uses for the Super Bowl. Cumulative or “reach” audience, favored by FIFA and Olympic broadcast reports, counts everyone who watched at least one minute of the broadcast worldwide, which naturally produces bigger numbers than an average. Peak audience captures the single highest-rated moment, often the final whistle or the anthem. Each entry below states which one applies, plus the domestic-versus-global scope, so the comparison is transparent rather than misleading.
The ranking
- 2008 Beijing Olympics Opening Ceremony: Nielsen estimated a worldwide television audience of roughly 2 billion people watched at some point, while a report commissioned for the IOC put the stricter “watched at least one minute” cumulative reach at 1.5 billion. Global, cumulative reach.
- 2022 FIFA World Cup Final (Argentina vs. France): FIFA reported close to 1.5 billion people watched at least one minute worldwide, with an average live audience of 571 million. Global, cumulative reach.
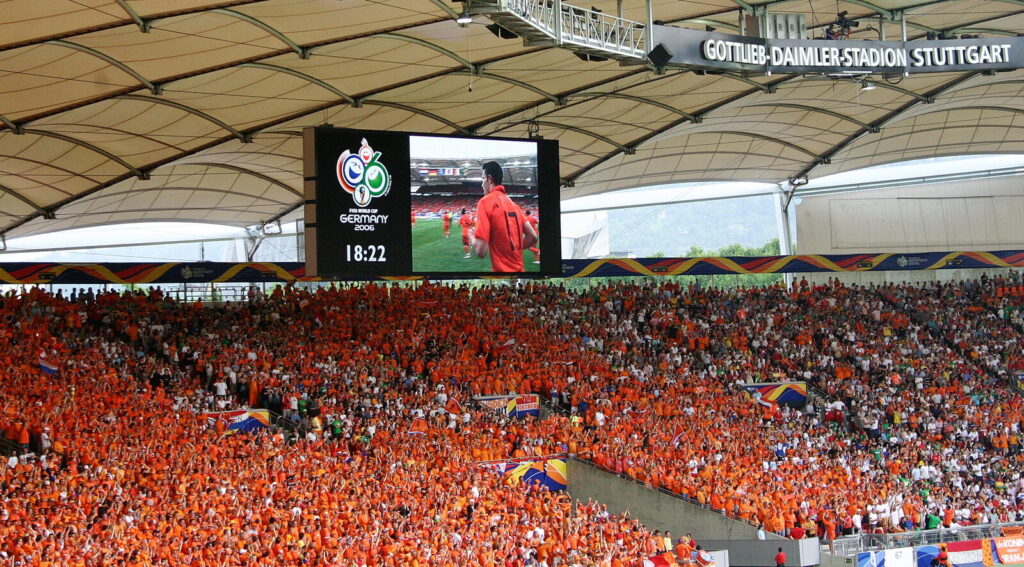
- 2010 FIFA World Cup Final (Spain vs. Netherlands): FIFA research found 909.6 million people watched at least one minute in-home, with an average in-home global audience of 530.9 million and a 20-minute peak of 619.7 million. Global, cumulative reach.
- 2012 London Olympics Opening Ceremony: the IOC estimated close to 900 million people watched at least part of the ceremony worldwide. Global, cumulative reach.
- 2024 UEFA Champions League Final (Real Madrid vs. Borussia Dortmund): UEFA put global viewership at 145 million, its highest figure of the modern reporting era for a single club match. Global, average/estimated audience.
- Super Bowl LIX (2025): Nielsen measured a record average audience of 127.7 million across Fox, Fox Deportes, Telemundo and Tubi, peaking at 137.7 million. U.S. only, average audience.
- Super Bowl LVIII (2024): Nielsen recorded a then-record average audience of 123.7 million. U.S. only, average audience.
- Super Bowl XLIX (2015): Nielsen measured 114.4 million average viewers, the most-watched U.S. television program of its time, peaking at 120.8 million. U.S. only, average audience.
What the numbers actually show
Stack these side by side and the honest takeaway is not that the Olympics or the World Cup “beat” the Super Bowl. It is that global cumulative reach and U.S. average audience are different units of measurement, roughly like comparing total marathon finishers to a runner’s fastest single mile. The Beijing ceremony and the two World Cup finals dwarf every American broadcast because they are counting a planet’s worth of viewers across dozens of time zones over 90 to 120 minutes, with the bar set at a single minute of viewing. The Super Bowl figures are stricter by design (an average, not a reach count) and confined to one country, which is exactly why three consecutive Super Bowls now sit among the most-watched single broadcasts the U.S. has ever produced even though none crack a billion.
The Champions League final sits in an interesting middle position: still a single club match rather than a nation-versus-nation event, yet its 2024 figure now tops any individual Super Bowl on a global basis, a reminder of how much the competition’s reach has grown. For more on how tournament structure feeds these audience swings, our explainer on every FIFA World Cup winner since 1930 traces how the event grew from a modest 13-team affair into the broadcast phenomenon behind these numbers.
One note on what did not make the list: several cricket broadcasts, including India’s 2011 World Cup final win, are frequently cited with global audience figures in the 500-600 million range. We could not independently confirm a specific worldwide number against two credible sources rather than aggregator sites recycling each other, so that entry was left out rather than published on a guess. That is also the standard the rest of our Data & Analytics reporting tries to hold to: a real number, checked twice, or no number at all.